
Last time we talked about the covid epidemic in Minnesota, I was trying to figure out why so few people were dying.
Don’t get me wrong, 357 Minnesotans died in the back half of May, in a state where the flu typically kills 191 Minnesotans in an entire year. It’s just that we expected more than double that number to die. I spent the past few weeks buried in spreadsheets (and spent hours and hours looking at Wayback Machine archives of this page) trying to figure out why we aren’t dying quite so fast.
Is it because we’re getting better treatments, reducing our fatality rate?
No. As far as I can tell, our infection fatality rate (percentage of infected people who don’t survive) has held steady for weeks. Don’t trust the actual numbers in this graph, but do trust the trend, which is flat:
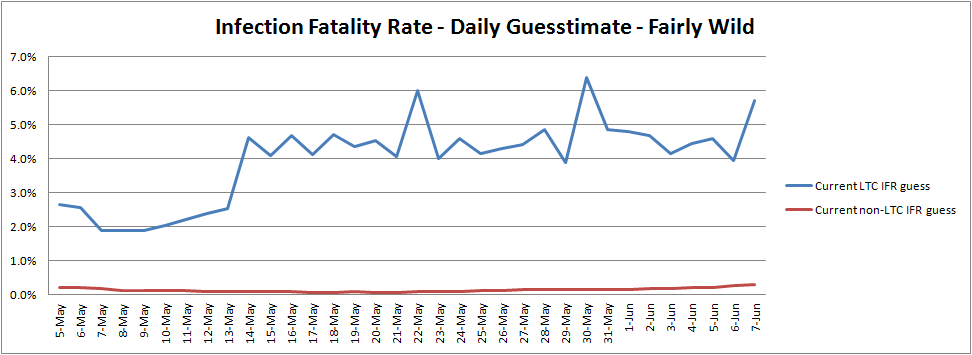
The state’s crude cumulative case fatality rate (which counts only reported cases, and makes no attempt to “snapshot” them) has also held steady since the initial wave of deaths:
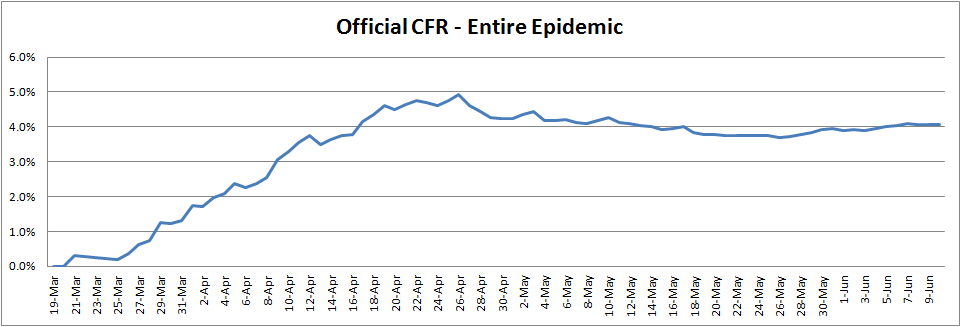
There are small recent changes on both these charts, but they seem to be related to random fluctuations, increases in testing, and occasional changes in our testing protocols, not actual success in making covid-19 less deadly.
So, if you catch covid, you’re still just as likely to die of it as a month ago. So, if we’re seeing fewer deaths, it must be because there are fewer cases.
Then… are deaths going down because the lockdown was more effective than we thought?
Nope. Deaths are going down, but the timing is all wrong to credit the lockdown:
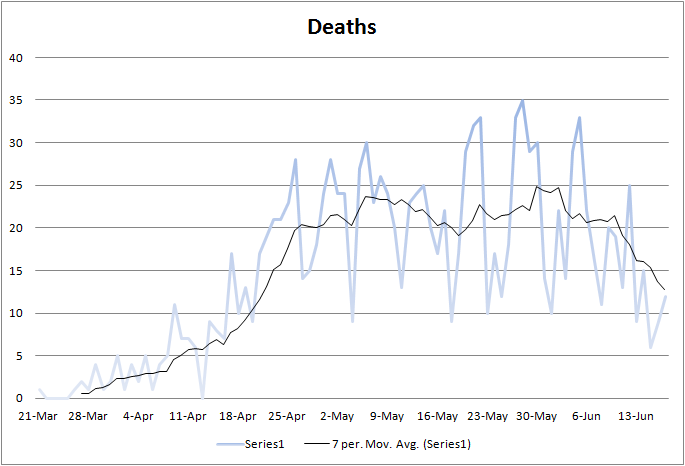
After weeks of flatness, deaths go into clear decline during the first week of June — three weeks after the lockdowns ended. That’s right around when we would expect deaths to start obviously going up. Once the lockdown ended, the Minnesota Model expected well over 100 deaths per day by early June, rising toward a peak of around 500 deaths per day later this month. Instead, we’re seeing less than 20 per day. And it’s been too long since lockdown ended for us to give the lockdown credit.
Okay, here’s an off-the-wall idea: maybe after the lockdown ended, Minnesotans were so scared they actually did more social distancing than they’d been doing during the lockdown? And all that extra distancing was actually more effective than the official lockdown and bent the curve downward? Seems implausible, since everyone seems to be loosening up rather than locking down, but worth checking anyway. Did Minnesotans reduce covid cases and deaths by voluntarily increasing social distancing in late May?
Nope:
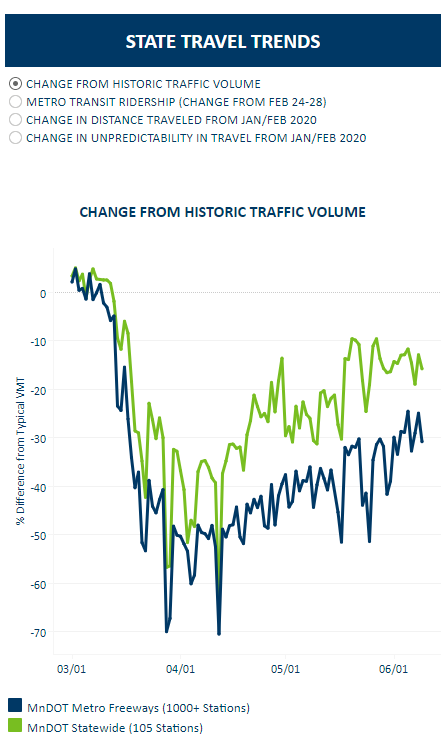
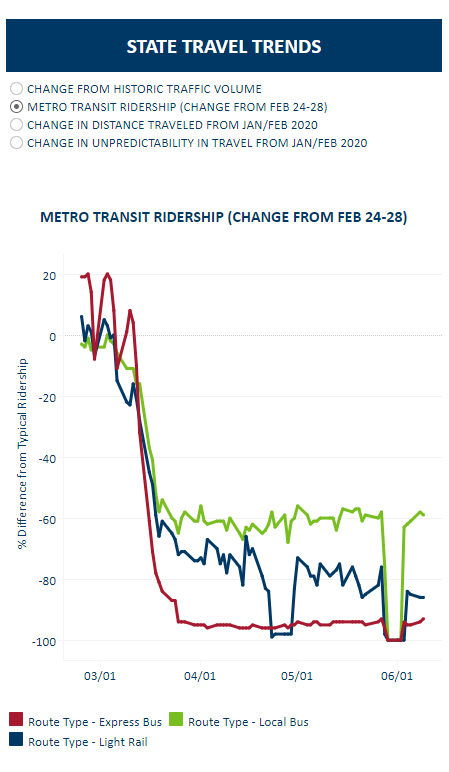
While Minnesotans are still distancing, and that’s undoubtedly helping prevent a spike, they’re loosening up slightly. We definitely aren’t distancing more than we were this time last month. So our voluntary distancing doesn’t explain the decline in cases.
Could Gov. Walz’s belated actions to protect long-term care (LTC) facilities be reducing cases in nursing homes — so much that they’re driving down case and death numbers for the whole state? This is an interesting idea I aired last time.
You can kinda talk yourself into it if you’re just looking at deaths:
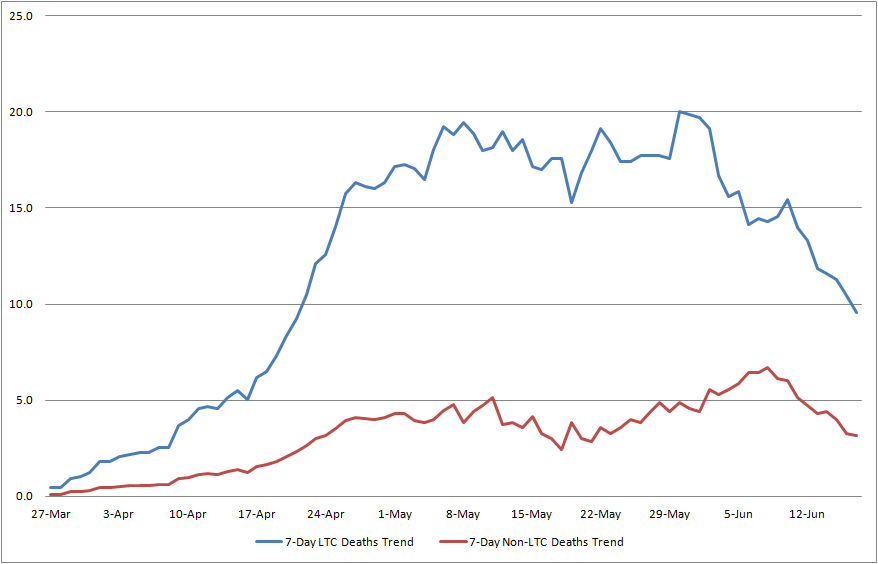
Deaths are down everywhere, but they’re down a little more sharply in LTC facilities. So Walz’s intervention can perhaps explain the decline in nursing homes; can it explain the overall decline in the state? (When I was looking at this a few days ago, non-LTC deaths were actually going up, which made this question more plausible.)
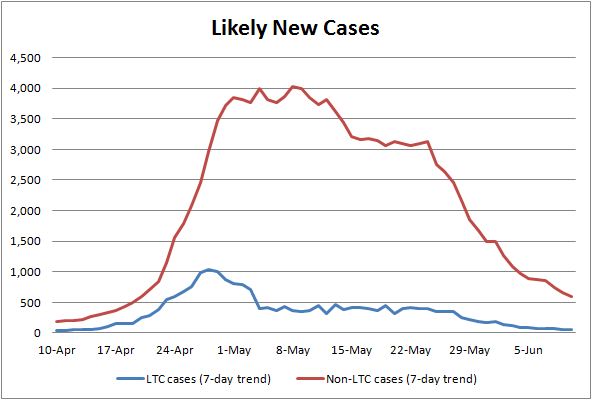
No. The nursing home death decline is great news. But cases are down sharply everywhere, both in and out of LTCs:
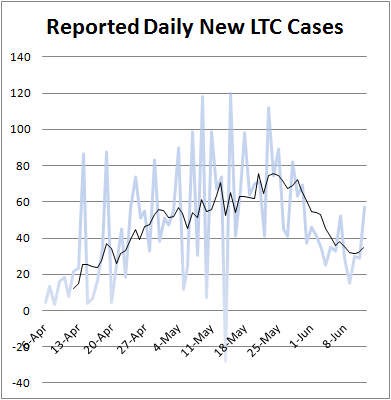
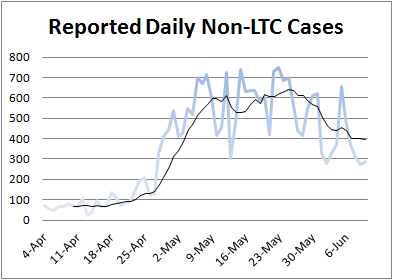
We can’t credit nursing home precautions for this. And, since there are far, far more non-LTC cases than LTC cases, the decline in LTCs would have to be much steeper to begin to explain the state’s overall reduction in cases.
Quick side note: this data is starting to get fairly patched-together. Minnesota changed how it reports LTC case numbers a couple times, and I had to do quite a lot of Wayback Machine dumpster diving to get apples-to-apples numbers to compare across all dates. You’ll notice on the LTC graph that there’s even a day, May 12th when new LTC cases apparently numbered -28. This is not real (obviously). It’s due to a rounding error in the reporting method Minnesota used at the time, corrected when they changed reporting methods the next day. Even with these corrections, I was only able to go back to early April, because data before then just isn’t available. That’s why I again encourage you to take the trends seriously but the specific numbers with a grain of salt. End of side note.
Both the above graphs are based on officially reported numbers. But, for much of May, we didn’t have nearly enough tests, and we can be certain that we were missing a large proportion of cases. (See my mid-May piece, “Where Are Minnesota’s Tests?“) For the entire first half of May, our weekly average test positivity rate hovered above 10%, with a one-day high of 20%. (To know how many cases there really are, it should be 2-3%.) We were undercounting in May by a huge margin.
Minnesota’s test positivity rate is now down to 3% and still heading downward. We aren’t undercounting anymore, at least not by much.
What if we try to account for this? What if we try to figure out how many actual new cases of covid there were in Minnesota each day, not just how many were identified? Well, you get something like this:
Again, don’t take the numbers on the Y-axis too seriously.
I did do my best to ground my assumptions about positivity rates and undercounting in real-world data. I spent a night digging through covid population studies, comparing states’ official covid prevalence and test positivity rate to the actual covid prevalence. This allowed me to form a baseline: if your testing positivity rate is 10%, then you’re probably missing 70-90% of actual cases. If it’s 4%, then you’re probably missing half of cases. And so on. Big thanks to Boise, Idaho and Indiana for making this possible — they both had good studies and, just as important, they had very usable covid-19 websites. (Especial thanks to Idaho for breaking out cases and tests by public health district!)
But, even with this grounding in some real data, the specific numbers are verrry iffy. Please don’t walk around saying that 4,028.6 Minnesotans were infected with covid on May 8th just because this chart (a smoothed average of a guesstimate built on patchy state data) says so. All we can say for sure is that, on May 8th, we detected 723 cases, with a 15% positivity rate, and so there were certainly thousands of cases that day that we didn’t detect. Maybe there were really 4,000 cases, maybe 2,000, maybe 7,000, but it was a lot more than we tested.
Regardless, the trend couldn’t be clearer, and it holds steady no matter how you play with the “undercount factor.” New cases in Minnesota dropped off a cliff at the end of May, precisely when we expected them to be heading skyward. This is true for LTC residents and other Minnesotans alike. I really wanted the nursing home hypothesis to fit, because it made sense of everything. But the data don’t support it.
What if covid is slowing down because we’re acquiring herd immunity?
On the one hand, there’s a certain attraction to this idea. An otherwise-unexplained quick collapse in the disease suggests lower transmission rates, and the gradual build-up of herd immunity gradually reduces transmission rates. Unfortunately, the numbers don’t add up.
If I’m very generous with my undercount estimates, I can just about believe that maybe 600,000 Minnesotans have been infected. Even if that were true, it would only be a little more than 10% of Minnesotans… and we would need several times that many to even begin to see herd immunity effects against covid. (In truth, I think the number of Minnesota infected so far is around 75,000 – 200,000.)
So what is slowing the epidemic down? We seem to have presented one hypothesis after another, only to discredit each one.
It could be a mystery, of course. Sometimes things happen and we don’t have good explanations for them. There always is an explanation, of course, but this is a very new disease, and virology is still routinely making major discoveries about diseases we’ve studied for decades. The real explanation may not be available to us until years from now.
But we do still have one hypothesis left in our quiver. It’s a hypothesis a number of respectable epidemiologists (the non-treasonous kind) have converged on in the past couple weeks–although it seems to me they’ve settled on it more by process of elimination than anything else. Their hypothesis?
It’s summer. Lots of respiratory viruses struggle in summer. They don’t reproduce as well, and/or they don’t transmit as well, and/or people congregate outdoors where viruses don’t have as easy a time spreading. We didn’t think the arrival of summer was going to be a big deal, but… hey, look at those numbers. It’s kind of a big deal.
Dr. Christakis thinks it (and actually this video segment, which he just reposted from way back in March, is worth watching), Scott Gottlieb thinks it, Lyman Stone (not an epidemiologist) is terrified because of it, Minnesota is gradually tacitly accepting it, and, as I’ve mentioned in previous blog posts, the evidence supports modest anti-covid effects from a rise in temperature.
It’s not strong evidence, and maybe there’s still some other factor helping out here, but it’s all I got: covid is weakening in Minnesota because summer.
That doesn’t mean we’re guaranteed an easy summer. A single super-spreader event could kickstart a new outbreak, which could get traction even with the hindrance of summer weather. These things happen, and they are three parts opportunity and two parts random luck. (I believe Dr. Christakis says “stochastic” in his video clip, but that just means “based on random luck.”) Indeed, some areas like Arizona and Florida seem to be already undergoing spikes.
We give the virus opportunities when we reduce social distancing. Fortunately, in Minnesota, social distancing has largely continued post-lockdown. It should continue to continue. I think we can loosen up a little — I’ll write about that as soon as I can — but you should not read this post and then dash off to the pool halls and roller derbies with all your chums because I told you it’s safe. It’s not. Covid’s still here, still contagious, still killing people twenty-five times faster than the flu. We haven’t found a way to reduce the fatality rate. And there’s a good chance (more than 65%, less than 100%) that it will be back in full force this fall.
But it’s giving us a breather. Let’s make good use of it.