
As we stop having earthshaking revelations every week and ease into watchful-waiting mode, I think a low-intensity summary of Where Things Are At might be a helpful thing to have periodically. I don’t know whether these will become weekly or what.
OVERALL:
In Minnesota, covid is still in a valley, not a peak. There are signs that may be changing, but they are developing slowly and aren’t clear yet. Continue enjoying your summer safely, with an emphasis on outdoor activities and small gatherings. Do not visit, e.g., Arizona.
DETAIL:
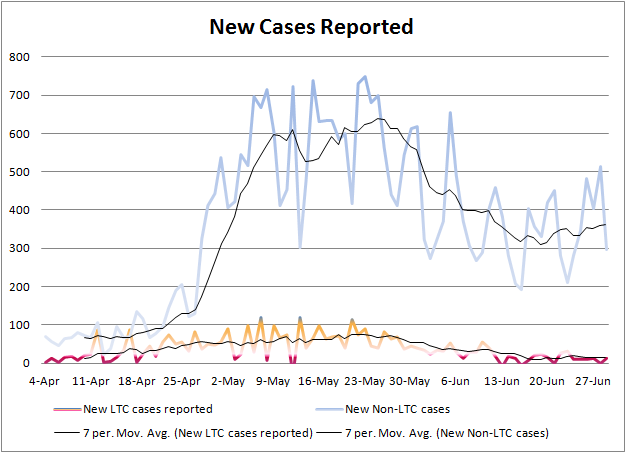
Case counts definitely trending upward, but still far below April/May peaks. This data lags by (in this case) six days.
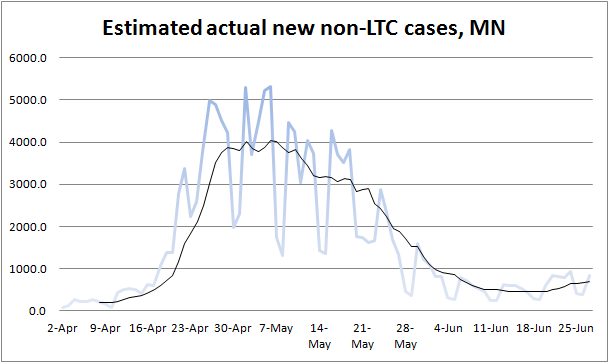
Positivity rate is rising in parallel with rising case counts, and my case estimator hates rising positivity rates — but it’s rising slowly enough, and is still close enough to the 2% ideal, that my estimate shows a slope, not a spike. This data also lags by six days.
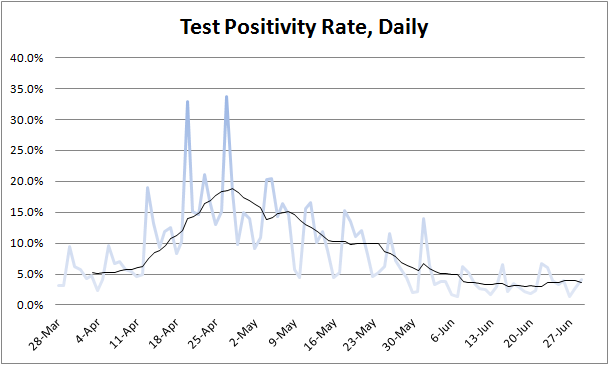
(For those interested, my daily estimate of “actual new cases” is derived by taking the current 7-day average positivity rate, dividing it by 2% to yield a multiplication factor (minimum 1.0), and multiplying the officially reported non-LTC cases by that factor. This is crude enough that, when positivity is significantly above 2%, the precise numbers may be way off… but accurate enough for us to trust the trendline.)
Hospitalizations are flat, about where cases were two weeks ago in reality. This data is current.
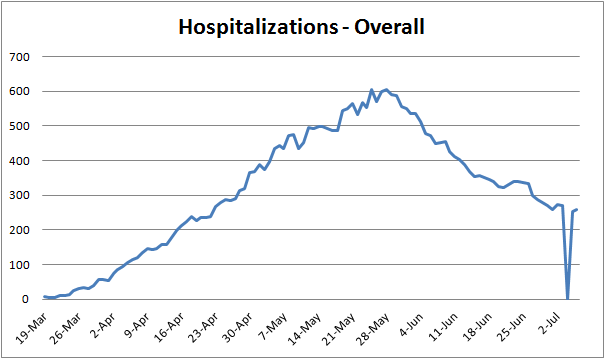
The state reported no data on July 4th (they took the day off for the first time since March), hence the down-spike on the 4th followed by the up-spike in “new” hospitalizations on July 5th. July 5th is simply both days combined:
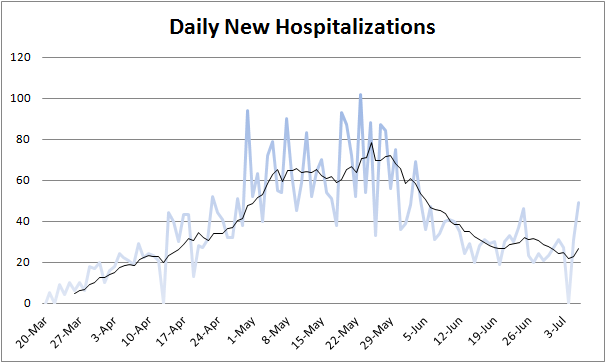
I wouldn’t be shocked to see hospitalizations rise in the next few days, as new cases start to turn into new hospitalizations. On the other hand, as cases become more concentrated among young people, I wouldn’t be shocked to see hospitalizations hold steady, or perhaps even decline.
Deaths are flat or declining, depending on what slice of data you’re looking at and how hard you squint. This data is current — but remember that it takes several weeks to die of covid, so, if cases go up, you’d expect to see deaths rise in 1-4 weeks.
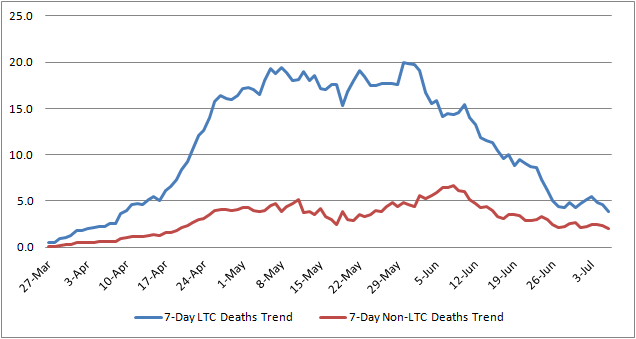
There’s still no indication in my data that the death count is improving because hospitals are getting better at treating this. By dividing deaths by my estimate for the actual number of cases, I’m able to come up with a rough estimate of infection mortality in Minnesota. It’s been holding steady in the vicinity of 0.5%-0.6% for a while, right in line with global estimates of how deadly covid is.
In other words, deaths seem to be falling solely because cases fell several weeks ago. As cases go up, we should anticipate deaths will go up in a few weeks. On the other hand, as young people become a greater proportion of the infected, we may see deaths hold steady or fall. I know, predicting “anything could happen” is not very bold, but I think there’s too much uncertainty for me — a non-epidemiologist — to be bolder than that.
All data is either directly from here or derived from data from here: Minnesota Department of Health: Situation Update for Covid-19 . I went into a little more detail on some of these data in my post Covid Isn’t Killing Minnesotans Like It “Should” a few weeks ago.
Reminder: I break these out between long-term care (LTC) and non-LTC residents where possible. Furthermore, I focus on non-LTC because most of the people reading this are not LTC residents, and most of my advice is not applicable to them.