
Over the past few weeks, I’ve been working on my opus And The War Came, about how America’s political institutions are considerably more fragile than widely believed. Since covid figures have been flat as a pancake for a while, I let these weekly covid updates lapse again.
But recent news reports have indicated a covid “surge” underway in Minnesota, and this seemed like a good reason to spend an hour updating my spreadsheets to see where we stand.
OVERALL:
There is no evident surge in Minnesota covid cases right now. Upward trends in confirmed case counts are largely due to increased testing, which is actually good news. Estimated cases are flat, hospitalizations are flat, deaths are flat.
Don’t get careless, because people are still catching covid and dying of it, and carelessness is how we get superspreading and actual spikes. And don’t assume these numbers will stay flat forever. But my recommendations largely haven’t changed.
THE RETURN TO SCHOOL:
I sent my eldest daughter to First Grade this week, full-time in-person, at a local Catholic school. They have been very creative about ways to ensure social distancing. I feel quite safe. However, as a precaution, I have stopped seeing my at-risk parents for the next few weeks while we see whether we actually are safe.
I’m much less confident that colleges and universities will be able to stay open for long, because their educational model simply doesn’t allow the level of social distancing my daughter’s First Grade class has achieved. Local colleges and universities have been ludicrously innovative in some ways (frustratingly pig-headed in others), but I’m not sure anything can keep them running. It will certainly be interesting to see which colleges succeed at in-person education over the next ten weeks or so.
DETAIL:
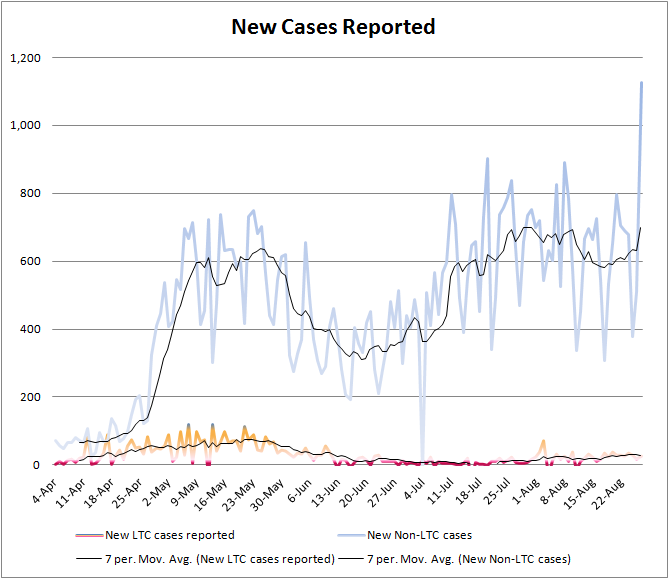
Our estimated case count remains largely flat. There’s a hint at a small rise right at the end of this data, and preliminary data for next week suggests that this rise is real and we’ll be seeing it next week. However, it’s no “second wave,” and we’ve had plenty of fluctuations of this sort over the past six weeks which soon reverted to the mean. We’ll keep a close eye on this, but, as of right now, it shouldn’t be a major concern for average Minnesotans. This data lags by (in this case) six days.

“LTC” is short for “long-term care” (basically, nursing homes). The above estimate is for non-LTC cases.
Nursing homes have seen a definite rise in cases over the past few weeks, possibly as residents and staff begin to relax tight restrictions from earlier in the pandemic… but they’re still in quite good shape compared to, say, May. (This estimate assumes test positivity rates between LTCFs and the general population are more or less the same.)

As I state every week, my daily estimate of “actual new cases” is derived by taking the current 7-day average positivity rate, dividing it by 2% to yield a multiplication factor (minimum 1.0), and multiplying the officially reported non-LTC cases by that factor. This is crude enough that, when positivity is significantly above 2%, the precise numbers may be way off… but it should be accurate enough for us to trust the trendline.
Here is the raw, official state data I use to build these estimates:
Some media continues to make hay about the fact that Minnesota is now registering its all-time highest daily case numbers. That is true! But a large portion of that is thanks to our expanded testing capacity, which is way, way, way above what we had during our first peak in April/May. That means that while we may be detecting as many — or even more! — cases than we detected during the first wave, there are almost certainly far fewer actual cases around the state. You can see that expanded testing capacity doing its job here:
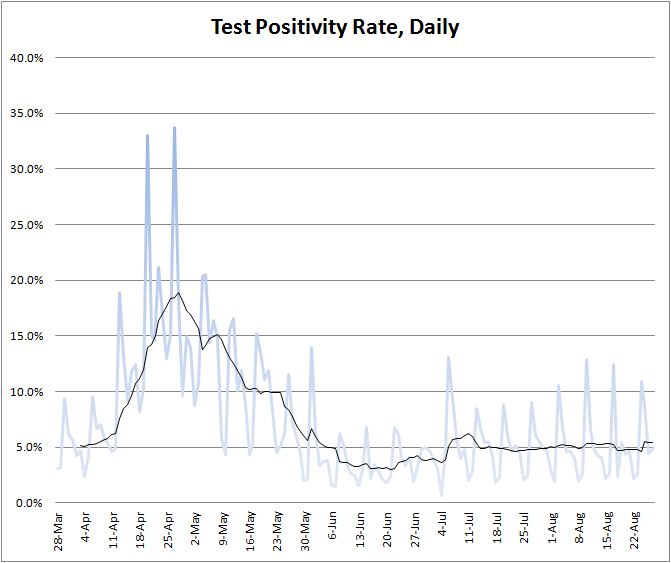
Lower positivity rates = fewer undetected cases = more accurate and higher official counts = lower actual cases.
As I noted at the top, all this data lags by 6 days. Preliminary data for the most recent 6 days looks somewhat worse, but not worse enough to justify alarm or school closures or anything of that nature.
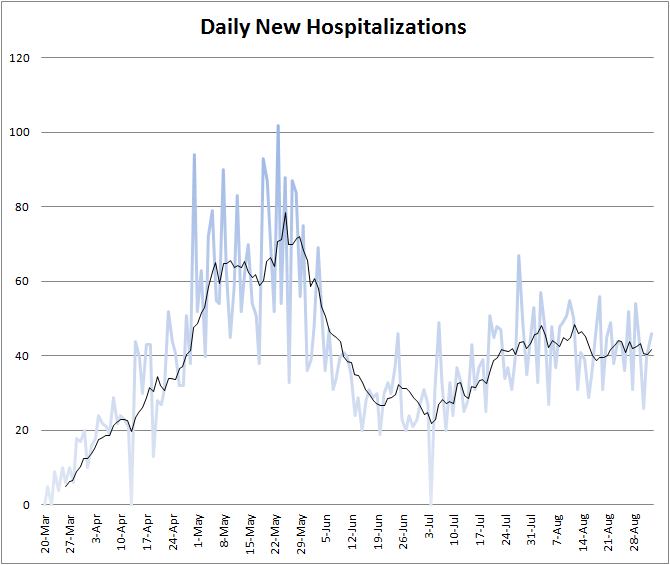
How are the hospitals doing? They’re working hard, but keeping their heads above water. This data is current as of yesterday at 4 PM:
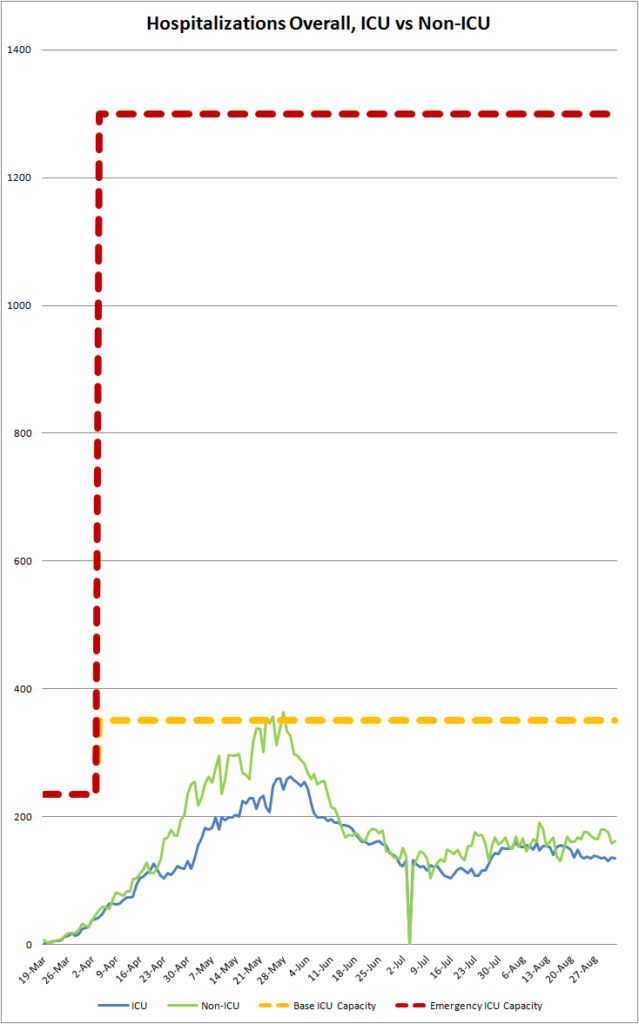
For our part, we aren’t exactly filling up hospital beds with new patients, either, which is consistent with my estimate that our overall case numbers are holding pretty steady.
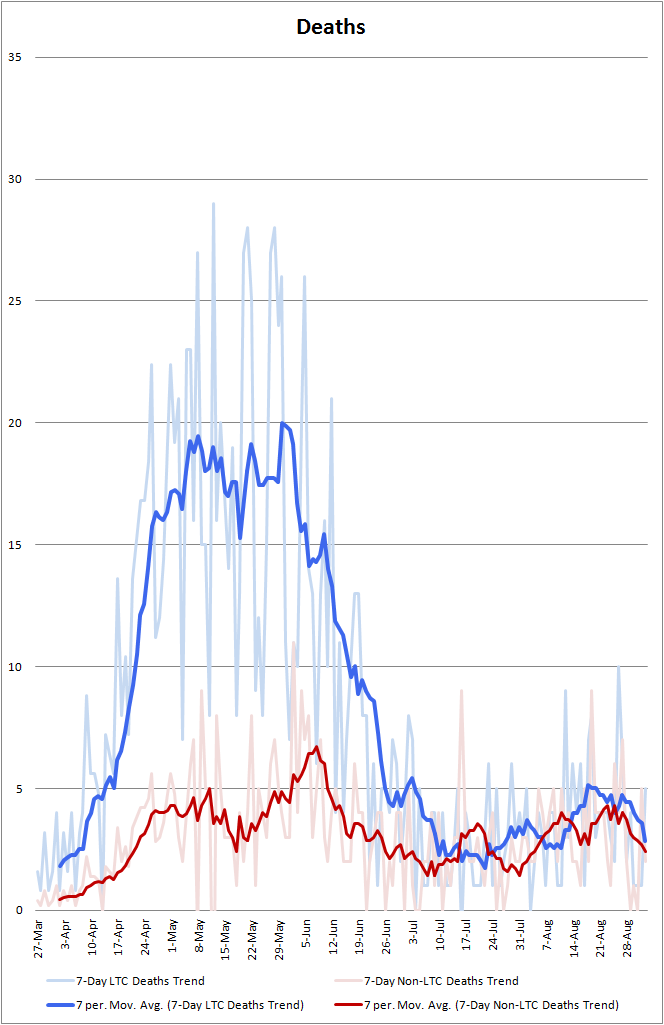
I finally redid my deaths chart to show data and trends better, and… well, it shows deaths are pretty flat, with the expected fluctuations when dealing with small numbers. Not sure what else to tell you here:
I’ve been toying with a theory for a few of these updates that Minnesota’s plateau is partly thanks to a spontaneous rise in social distancing, as suggested by the state’s “change in distance traveled” figures. I told you in August that the data lagged by so long that we wouldn’t know the truth until September. Did my theory bear out? Eh, kinda. As our case growth plateaued, distance traveled fell… then ended up rising again, then falling again, and ended up more or less plateauing.
It’s plausible that Gov. Walz’s mask mandate is contributing to this, as it’s now had enough time to “work,” but I don’t see any movement in the data that seems directly attributable to the mandate.
AGAINST CONVENIENT LIES
Nationwide deaths from covid-19: 176,624, +/- maybe 20% due to under- or over-reporting. There are definitely some people who died of car crashes (and under other, less black-and-white, circumstances) who got counted as covid deaths. There are also definitely some people who died of covid and didn’t get noticed, but who show up in the excess death figures (some other excess deaths were people killed indirectly by the lockdowns). Those undercounts and overcounts likely cancel each other out to some extent.
Please do not buy into the ridiculous fake news this week that “only 6% of those people ACTUALLY died” of covid; it’s silly and falls apart the second you open the CDC report the claim comes from and read the related data table in context. I’m going to resort to linking an Instagram doctor who can debunk this one visually, but, seriously, read the report yourself; it’s written in ordinary English. There’s no need for anyone to be dumb about this. Being dumb about it is a choice.
Meanwhile, please stop worrying (read: concern trolling) about Sturgis. It was always difficult to make the case that Sturgis was going to be more dangerous than the mass protests and rioting. Those riots yielded (1) no discernible increase in cases or deaths, and (2) widespread establishment denunciation of the suggestion that the protests could possibly have any bad effects ever (even when those effects were visible on camera). Suddenly rule #2 went away for Sturgis, apparently because it was going to be populated by all those mean, nasty conservatives, and some argued, idiosyncratically, that Sturgis-goers weren’t social distancing as well as looters in a burning Target.
Sturgis ended two and a half weeks ago. If it were going to cause a spike in Minnesota, we’d have seen it by now. We haven’t. If you only condemn or “worry about” mass gatherings with people from the Red Tribe, while giving a pass to or participating in Blue Tribe mass gatherings (I SEE YOU STEVE SACK, YOU JERK), you’re not only making America’s covid problem worse, but you’re one of the causes of that civil war I was writing about for the past couple weeks.
SELECTED GROWTH RATES
Average week-over-week growth in estimated cases, July 30th-Aug 6th: 3%
Aug 7th-13th: -3%
Aug 14th-20th: -6%
Aug 21st-27th: -2%
Date I expect Minnesota’s second peak to surpass its first peak: [not currently trending in that direction].
Please note that predictions I have made about this pandemic have had some hits and some very notable misses.
All data is either directly from here or derived from data from here: Minnesota Department of Health: Situation Update for Covid-19 . I went into a little more detail on some of these data in my post Covid Takes A Breather a few months ago.
Reminder: I break these out between long-term care (LTC) and non-LTC residents where possible. Furthermore, I focus on non-LTC because most of the people reading this are not LTC residents, and most of my advice is not applicable to them.