
The day of the Brexit vote, the very first constituency to report results, Newcastle-upon-Tyne, reported a defeat for Brexit, 51%-49%. The defeat for Brexit there was expected. However, the margin was wrong: experts had expected Brexit to fail in Newcastle by 12 points, not 2 points. Newcastle had been a “safe state” for Brexit that turned into a narrow win.
I was over at my parents’ for dinner, just buzzing by the computer for a quick results check, didn’t even bother sitting down—and I remember seeing that result, sitting down heavily, and thinking, “Welp. The U.K. just left the E.U.”
The rest of the night went the same. Areas that were expected to vote for Brexit by a narrow margin voted for it by a large margin; areas that were expected to oppose it by narrow margins ended up supporting it by narrow margins. There were a few places where the anti-Brexit “Bremain” vote did better than expected, as there always are… but not many. Networks finally called the race hours after the result was clear.
This happened again in the 2016 presidential election. I told my family at 8:15 PM that Trump was very probably the President, because I could see that all the states Trump needed were getting called for him (or were on the cusp of it), and all the states Clinton needed were tossups… most of them leaning red.
I don’t expect that to happen again. President Trump starts today in a much worse position than he was in last time around. Last time, I told you that all Trump needed was a small polling error in his favor to win, that those kinds of polls happened all the time,and that the pundits were wildly underestimating Trump’s chances. Today, if anything, I think pundits (always fighting the last war!) are overestimating Trump’s chances. Last time, the polls were within the margin of historically normal error. That wouldn’t be nearly enough this time. But Trump could still pull it off. Totally plausible. Meanwhile, Republicans have a real shot at holding the Senate, or losing it only narrowly. So let’s take a look at three different ways we can track the race as it unfolds:
Congress-Level
Every seat in the House of Representatives is up for election this year, as usual. Congressional races are probably going to be the earliest (easily-accessible) indicator we have of how the night is going.
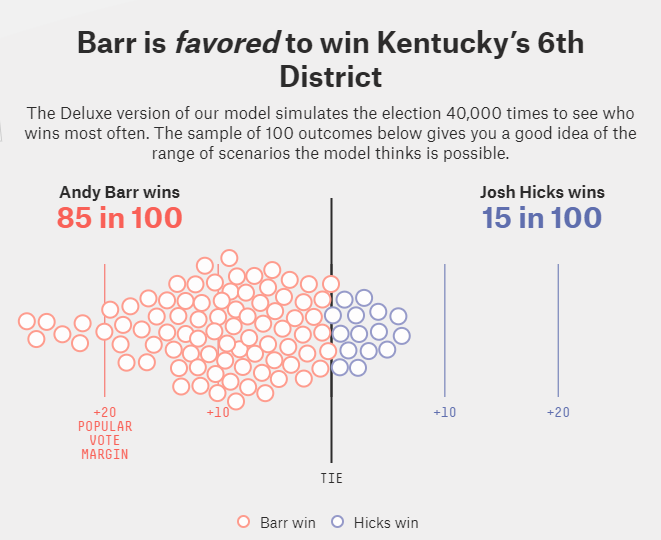
Here’s my Newcastle-upon-Tyne for Election 2020, my start-of-the-night bellwether:
Kentucky’s 6th Congressional District race between Rep. Andy Barr (R) and challenger Josh Hicks (D). Here is the Wikipedia article on the district, and here is the FiveThirtyEight race projection.
This is a pretty Republican district (Cook PVI R+9), but it’s a nice urban/rural/suburban mix around Lexington and Frankfort. The electorate resembles the voters both campaigns need most: Midwesterners and Pennsylvanians. (Sorry, Pennsylvania, you’re not in the Midwest.)
KY-6 is considered a battleground district, and polls there close early (5 PM Central), in a state where MOST of the vote is expected to be counted fairly quickly. There’s a lot of justified national concern about “red shifts” and “blue shifts” in the vote totals as the week goes on and absentee votes get counted, but there isn’t a lot of evidence that that will happen in this race.
So how can we map the results of this race onto the national outcomes?
On a “normal” night for Republicans, where the election forecasts are basically accurate, Barr wins by 10 points, dispatching Hicks fairly easily. Then Trump goes on to lose the presidential election and the Democrats end up with 52 Senate seats, because normal is not enough for Republicans who are this far down in the polls. Call this 20% likely to happen.
On a “good” night for Republicans, Barr wins by 15 points. Trump likely still loses the White House, but the Senate is competitive, and the GOP gains seats in the House, though not many. Also ~20% likely.
On a “great” night for Republicans, Barr wins by 20 points, the GOP holds the Senate and gains more House seats, and Trump is a photo finish for the White House. Expect to wait several days for a final result in that race. This is only ~15% likely.
On a “shocking” night for Republicans, Barr wins by 25, the GOP holds the Senate, makes major gains in the House (conceivably even winning it back), and we know fairly early that Trump has not only been re-elected, but has likely won the national popular vote. This is only 5% likely or so.
Now we’ll go the other direction. The probabilities are roughly the same.
On a “bad” night for Republicans, Barr wins by 5 points, Biden wins, Democrats end up with 54 Senate seats and substantial gains in the House.
On a “terrible” night for Republicans, Barr’s race is too close to call, Biden wins, and Democrats end up with 55-56 Senate seats.
On a “horrifying” night for Republicans, Barr loses by 5 or more; Biden wins Texas, South Carolina, Montana, and Missouri; Democrats end up with 57 Senate seats and 260+ House seats.
This is a lot of prognostication to base on the outcome of a single House race in Kentucky, so take it with some big grains of salt. In 2018, what looked like a “bad” night for Democrats at first eventually turned into a “normal” night for Democrats, so there’s definitely room for this to slide around as the night goes on.
This year, there’s a lot more reason to worry about that than usual, for all kinds of reasons (but mostly absentee voting). And there are always a few bizarre flukes in election outcomes, especially lightly-polled House races. KY-6 could be one of them, and that would make this whole analysis worthless.
But the fun thing is… you can run this analysis for any remotely competitive House race. Just take any race, look at the FiveThirtyEight projection and draw the same lines on it.
For example, in Minnesota’s 3rd District, start from the left and count the first five balls. Kendall Qualls is in a photo finish in most of them, so that’s what would likely happen on a “shocking” night for Republicans. In the next 15 balls, Qualls loses by around ~10 points, so that’s what would happen on a “great” night for Republicans. If MN-3 announces that Dean Phillips won by 27 points, you know Republicans are having a “terrible” night.
Do this on lots of different House races as they get called—the more competitive the race, the better—and you’ll have a pretty clear picture of how things are going before the West Coast even starts counting.
UPDATE: It took a few hours to get the vote count fully in, and it started out blue because of the early vote in Kentucky getting tabulated first — but Barr won by just about 18 points, and Republicans went on to have a great night.
State-Level
States are going to be tough tonight. Different states always count at different paces (and California always takes weeks to get it all done), but tonight is going to have a lot more disparity than usual. The most important state in the election by far, Pennsylvania, is unlikely to have meaningful results for several days. Worse: there’s a strong divide between Democrats and Republicans this year on absentee voting, which has never happened before. Worse still: because different states count absentee ballots at different times, some states are likely to report heavily Republican results early, then more Democrats results later on, resulting in a “blue shift” toward the Democrats. Other states will have the opposite happen: a “red shift.”
In short, it stands to be a very confusing night for the decision desks at the various news networks. You, the viewer at home, will be well-advised to wait patiently for network calls at the state level, unless you’re some kind of precinct-level vote parsing machine. (See below.)
That doesn’t mean we can’t still watch the states, though. FiveThirtyEight has a very good Election Night Viewer’s Guide that tells us when each state expects to report results and what “shift” is expected (if any).
I will be following DecisionDeskHQ‘s calls all night. DDHQ is much more transparent and aggressive about its calls than the AP and most news networks, but it also has a track record of being right, because it follows the data.
FiveThirtyEight then has a really wonderful real-time projection calculator. I will be keeping this open all night, updating it as official state calls come in.
If New Jersey goes for Biden early, it doesn’t have much effect on the race… but, if Georgia goes for Biden early, the race is over.
Trump’s must-win battleground states are: Georgia, Florida, North Carolina, and Ohio. He trails in all of them right now. If he loses any of them, this is over.
Biden’s must-win battleground states are: Colorado plus two or more of Michigan, Minnesota, and Wisconsin. If Biden can’t hold his must-wins, he still (unlike Trump) has some chance to rebound (that’s the advantage of a big polling lead), but his path to victory becomes extremely narrow.
The tipping-point state: Pennsylvania. If Trump wins Pennsylvania and holds his must-win states, Biden’s only hope of winning runs through Arizona on what has turned out to be a pretty red night. By contrast, if Biden wins Pennsylvania and holds his must-wins (which he almost certainly will if he wins PA), then Trump has no path to victory. While it may not technically end up the tipping-point state when all’s said and done, it’s hard to overstate Pennsylvania’s importance if the election is close.
Unfortunately, PA is unlikely to turn in anything like complete results for days—weeks if there’s lawsuits. Plus, because Pennsylvania is run by deeply partisan institutions that hate each other and act like idiots, under an election law that might charitably be described as “dysfunctional”… Pennsylvania is ground zero for a Florida 2000-style recount disaster.
See my examination of Pennsylvanian/American election dysfunction, and how it could plausibly (but improbably) spiral into an American civil war, in my recent post “And The War Came.” Then pray for a landslide.
County-Level and Precinct-Level
If you are a bit of a data wizard, this is the best and fastest way to track the election. Once an entire precinct or entire county has reported results, you can compare the results to benchmarks from previous elections and/or benchmarks set by detailed polling and/or benchmarks set by demographic profiles of the electorate. (Ideally, you’d do all three.) Then you can run the same basic analysis I ran through for Congressional races and, boom, you have hyper-detailed data on how the race is going for certain demographics or in certain areas. (Is Trump beating his polls in non-Cuban Hispanic areas? Good news for his Arizona results! Is Biden racking up points in suburban precincts? Good news for his everything results!) Do this a few hundred times, and it aggregates to a hyper-accurate projection of how the race is going.
I can’t manage this this year. My benchmark site from 2016 has gone away, and I’m going to have too much difficulty sorting out the meaning of precinct-level results based on the state’s particular policy on how absentee ballots are reported.
Fortunately for us all, Nate Cohn is still running the wonderful Upshot blog at the New York Times (a spin-off of FiveThirtyEight from its days as an NYT property, because all good election forecasting websites are run by 538 alumni; see also Harry Enten at CNN). And the Upshot is known, above all else, for one thing:
The Upshot is bringing back The Needle! (But only for three states.)
The Needle was the first major news tool to realize that Donald Trump was going to win the 2016 election (permanently traumatizing some), and it did that because The Needle does all this county and precinct tracking that I’m talking about, brilliantly, automatically, in real time.
Due to the same problems I mentioned, The Needle is limited to three states this year: Georgia, Florida, and North Carolina. Oh well. Those are all Trump must-win states.
So keep an eye on The Needle. If Trump wins all three—especially if he wins them early—he’s a tossup to win the election, and it will probably all come down to Pennsylvania. (There are other possibilities, but Pennsylvania looms large.) On the other hand, if Biden wins any of the states The Needle is tracking, or keeps them close for a lot of the night, it’s going to be very hard for Trump to make a comeback. The Needle will tell you how it’s looking a long, long time before the networks call it.
In fact, the network decision desks all basically have their own internal versions of The Needle, and the usual rule, post-2000, is that a network calls a race only once their internal Needles announce a >99% likelihood of a candidate winning it. So watching the Upshot’s Needle is a lot like looking in at a network decision desk in real time, hours before the call gets made.
(Assuming, that is, that The Needle doesn’t break, which is exactly what it did in 2018, to our great dismay.)
That’s it!
One asymmetry worth noting before I sign off: if Biden wins, we are likely to know it by Wednesday morning. If Trump wins, we very probably won’t know for days or weeks. That’s both because Trump is likely to win only in a very close race (which may hinge on a recount), and because most of Trump’s paths to victory go through Pennsylvania, which counts slow.
It’s also possible that a close race takes days to resolve and ultimately goes to Biden, but this is not especially likely. So Trump supporters should be cheering for a long, long night tonight (and tomorrow, and the day after).
For more viewing-guide fun, check out the Upshot’s hour-by-hour guide to the results, and follow FiveThirtyEight’s election liveblog!
Some passages in this post are openly plagiarized from a similar post I wrote in 2016.